
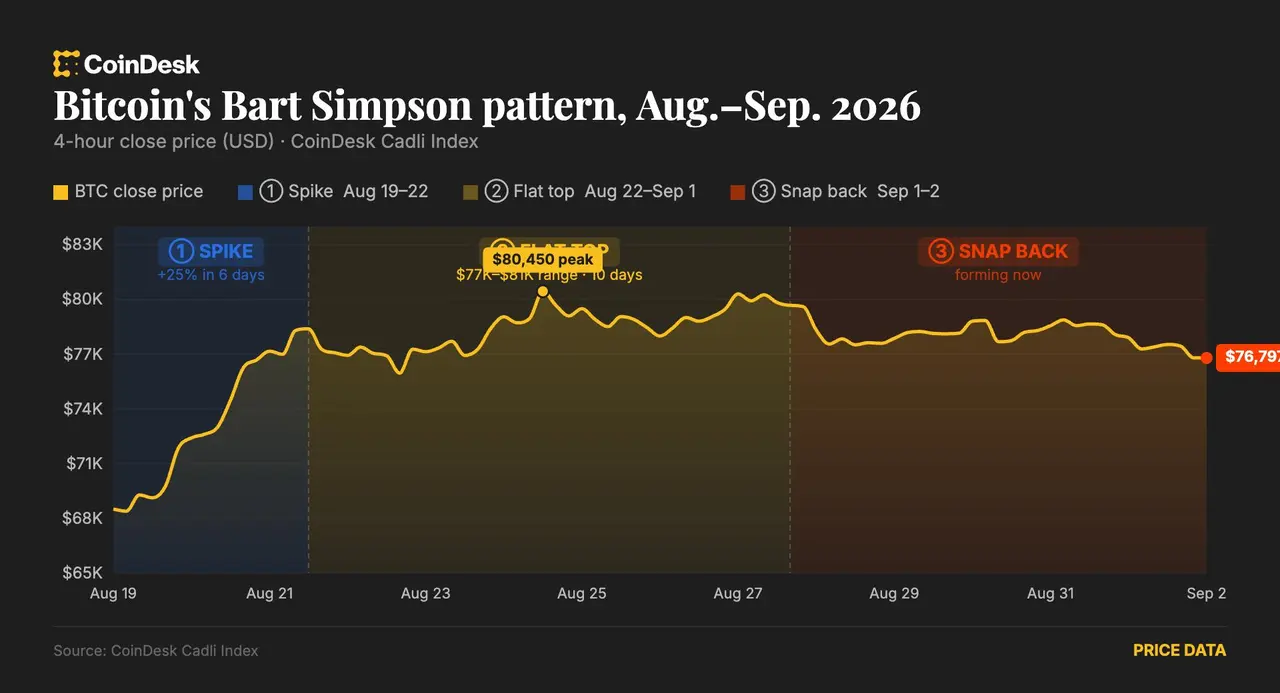
Bitcoin and XRP prices have retreated in recent trading, reviving talk of the so-called "Bart Simpson" chart pattern as analysts debate whether the formation will fully take shape.
What Is the 'Bart Simpson' Pattern
The pattern earns its cartoonish nickname from its distinctive shape on price charts. It resembles the flat-topped head of the beloved animated character, featuring a sharp vertical spike, a period of sideways consolidation along a flat top, and then an equally abrupt drop back down.
Traders view the formation as a bearish signal because it typically indicates that a rapid price surge lacked sustainable momentum. Once buying pressure fades, the price collapses just as quickly as it climbed, leaving those who bought at the top nursing losses.
When a rally goes straight up and then straight back down, it rarely ends well for late buyers.
The pattern has become a recurring feature in crypto market commentary, often cited during volatile periods when digital asset prices swing wildly in short time frames.
Prices Pull Back Across Major Tokens
The renewed chatter comes as bitcoin and XRP both showed weakness, with prices softening after earlier gains. The pullback fueled speculation among market watchers about whether the classic bearish setup is genuinely forming or merely a temporary dip.
Not all analysts agree on the interpretation. Some contend the recent price action fits the mold of the pattern, while others argue the market has yet to confirm the full formation and caution against reading too much into short-term movements.
Key points from the current market discussion include:
- Bitcoin retreated after recent gains, prompting technical analysis
- XRP also wilted alongside broader market weakness
- Analysts remain divided on whether the pattern will complete
As is often the case with chart-based predictions, the debate underscores the difficulty of forecasting crypto price direction. Whether the "Bart Simpson" pattern fully materializes will depend on how prices behave in the sessions ahead.