
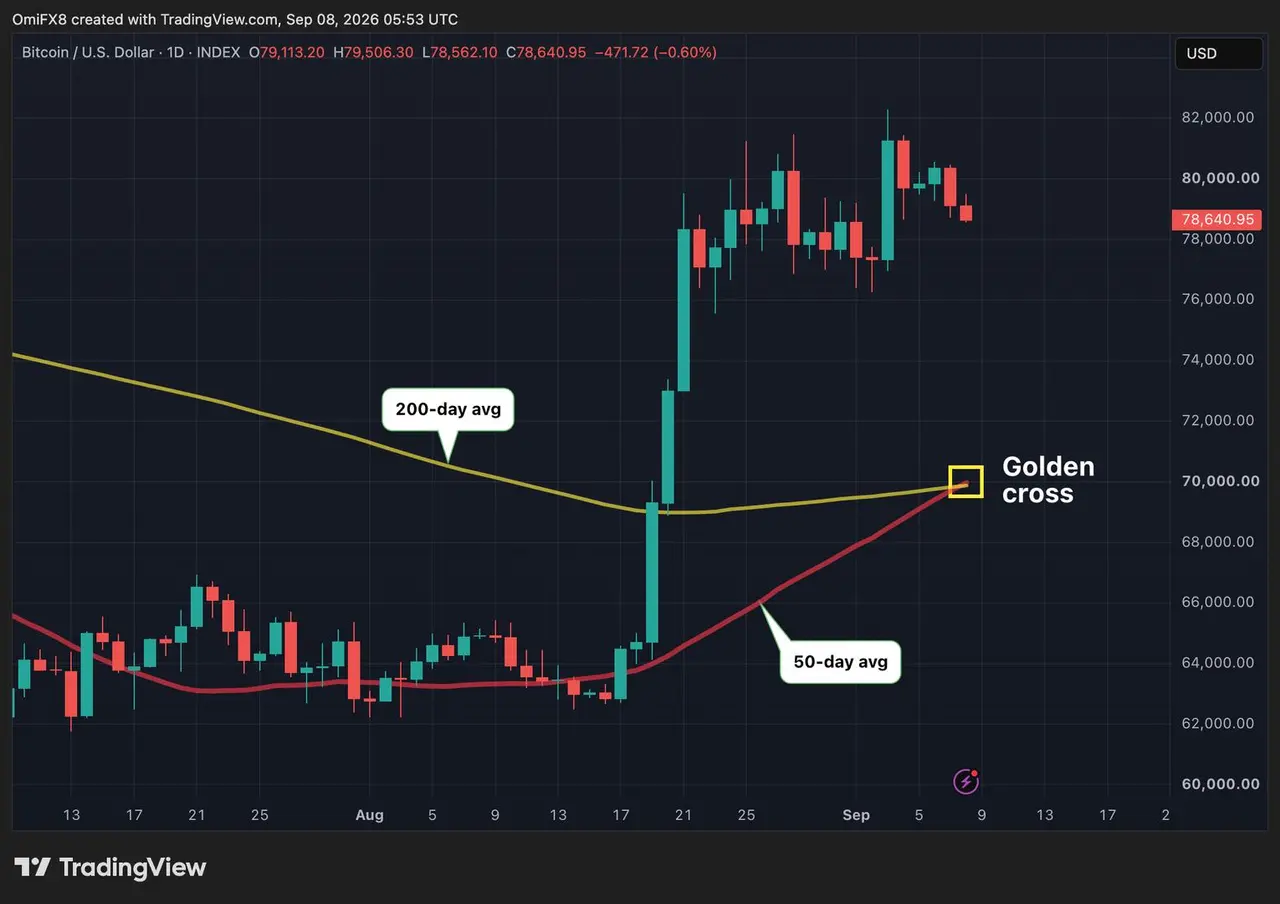
Bitcoin has flashed a widely watched technical signal known as a golden cross on its daily price chart, a development that traders often interpret as a sign of a potential long-term uptrend for the world's largest cryptocurrency.
What the Signal Means
A golden cross occurs when a shorter-term moving average climbs above a longer-term one, typically the 50-day moving average crossing over the 200-day moving average. Chart watchers view the pattern as evidence that recent momentum is strengthening relative to the broader trend, and many treat it as a bullish indicator that could point to further gains ahead.
The appearance of the crossover on bitcoin's daily chart has drawn attention from technically minded traders who use such patterns to gauge shifts in market sentiment. While the signal is backward-looking by nature — it forms only after prices have already moved higher — it remains one of the most commonly cited setups in market analysis.
The golden cross is one of the most closely watched bullish signals in all of technical analysis.
Reading the Caveats
Despite its reputation, the golden cross is far from a guarantee of future performance. Because moving averages are based on past price data, the signal can sometimes appear after much of a rally has already played out, occasionally leaving latecomers exposed to pullbacks. Analysts frequently caution against relying on any single indicator in isolation.
Traders typically look for confirmation from other factors before acting, including:
- Trading volume accompanying the move
- Broader macroeconomic conditions
- Momentum indicators and support levels
For now, the signal adds to the ongoing debate over bitcoin's direction. Whether the crossover translates into sustained upside will depend on how the market behaves in the sessions ahead, and technical setups can reverse quickly if buying interest fades.