
Bitcoin and XRP traders are keeping a wary eye on a chart formation nicknamed the "Bart Simpson" pattern, as major cryptocurrencies retreated and analysts debated whether the ominous setup will fully play out.
What the Bart Simpson Pattern Signals
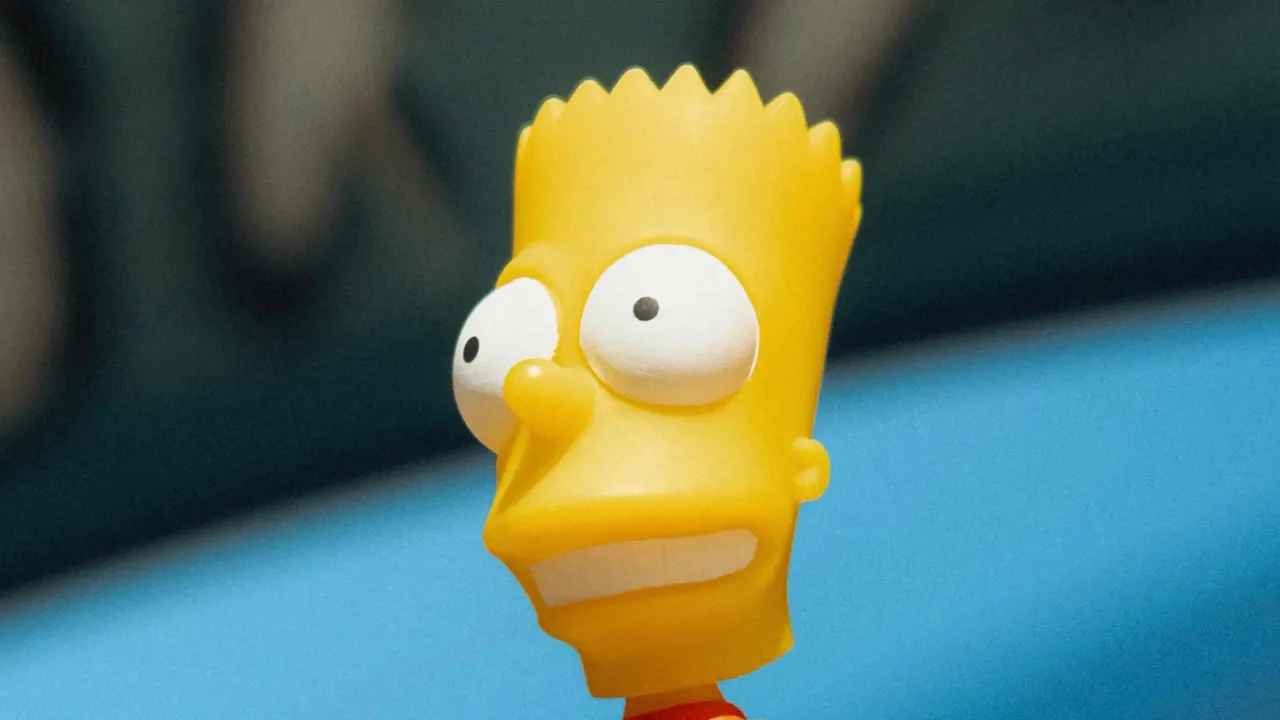
The Bart Simpson pattern gets its name from the flat-topped hairstyle of the cartoon character. On a price chart, it describes a sharp vertical spike followed by an extended sideways plateau, and then an abrupt drop that mirrors the initial surge. The shape resembles Bart's iconic head profile.
Traders view the pattern with suspicion because the sudden run-ups and equally sudden collapses often reflect thin liquidity or coordinated buying rather than sustained demand. When the plateau breaks downward, it can leave latecomers holding positions bought near the top.
The cartoon-shaped chart is a punchline until the price falls off the plateau.
Market watchers noted that the recent action in bitcoin resembled the early stages of the formation, prompting caution among short-term traders who fear the right side of the pattern — the steep decline — could still materialize.
Prices Wilt as the Debate Continues
The discussion coincided with a broad softening across major digital assets. Bitcoin pulled back from recent levels, and XRP followed suit, adding fuel to the concern that the market could be entering the downside leg of the pattern.
Not everyone is convinced the formation will complete. Some analysts argued that the pattern is often identified only in hindsight and that current conditions could just as easily resolve with consolidation or a renewed push higher rather than a sharp sell-off.
- Bitcoin retreated from recent highs as traders grew cautious.
- XRP tracked the broader weakness across the market.
- Analysts remain split on whether the full pattern will form.
For now, the market appears to be in the flat, uncertain middle section of the shape — the part where traders wait to see whether the next move confirms the feared drop or breaks the script entirely.